Understanding adaptive experiment progress and results
Let’s analyze how an adaptive experiment progresses, using a real-life example. We’ll see how the selection probabilities and our uncertainty about each condition change as we collect more data.
Recall the following definition of adaptive experimentation:
Condition: A specific treatment, arm, or variation assigned to a participant during the experiment.
Reward: A measurable outcome or benefit that results from a participant’s interaction with one of the conditions. In the simplest case, the reward can be binary: a success or a failure, e.g., answering a test question correctly or not.
Probability of Selection: The probability that determines which condition will be assigned to the next participant. This probability changes based on what we’ve learned so far and how uncertain we are about each condition. For example, if Condition A has shown better results than Condition B, we’ll assign more participants to A, but we’ll still occasionally try B to make sure we’re not missing anything.
Posterior Probability: Our updated belief about how well each condition performs after seeing the actual data. Think of it like updating your confidence about a website feature: You start with an initial guess (prior belief) of a 50% chance it will lead to a purchase. After seeing 7 successful purchases from 10 users, you update your belief to be more confident that the feature helps increase purchases. This updated belief then guides future decisions about using the feature.
Example: Coffeshop Marketing Strategy
As a newly hired marketing strategist at Starcoffee, you are tasked with finding the optimal way to advertise discounts to customers to encourage purchases while maintaining profit margins. You have designed the following three discount advertising conditions. The marketing team has decided to run a response-adaptive experiment to further validate which condition works best:
Condition 1: The customer receives a fixed $5 off their next purchase over $15.
Condition 2: The customer receives 40% off their next purchase of any amount.
Condition 3: The customer can buy one coffee and get complimentary snacks or breakfast on their next purchase.

Question:
What is the reward variable in your experiment design?
The reward variable is whether or not the customer make a purchase.
Question:
Is this reward a Binary reward?
Yes it is! It is either the customer make a purchase (1) or not make a purchase (0).
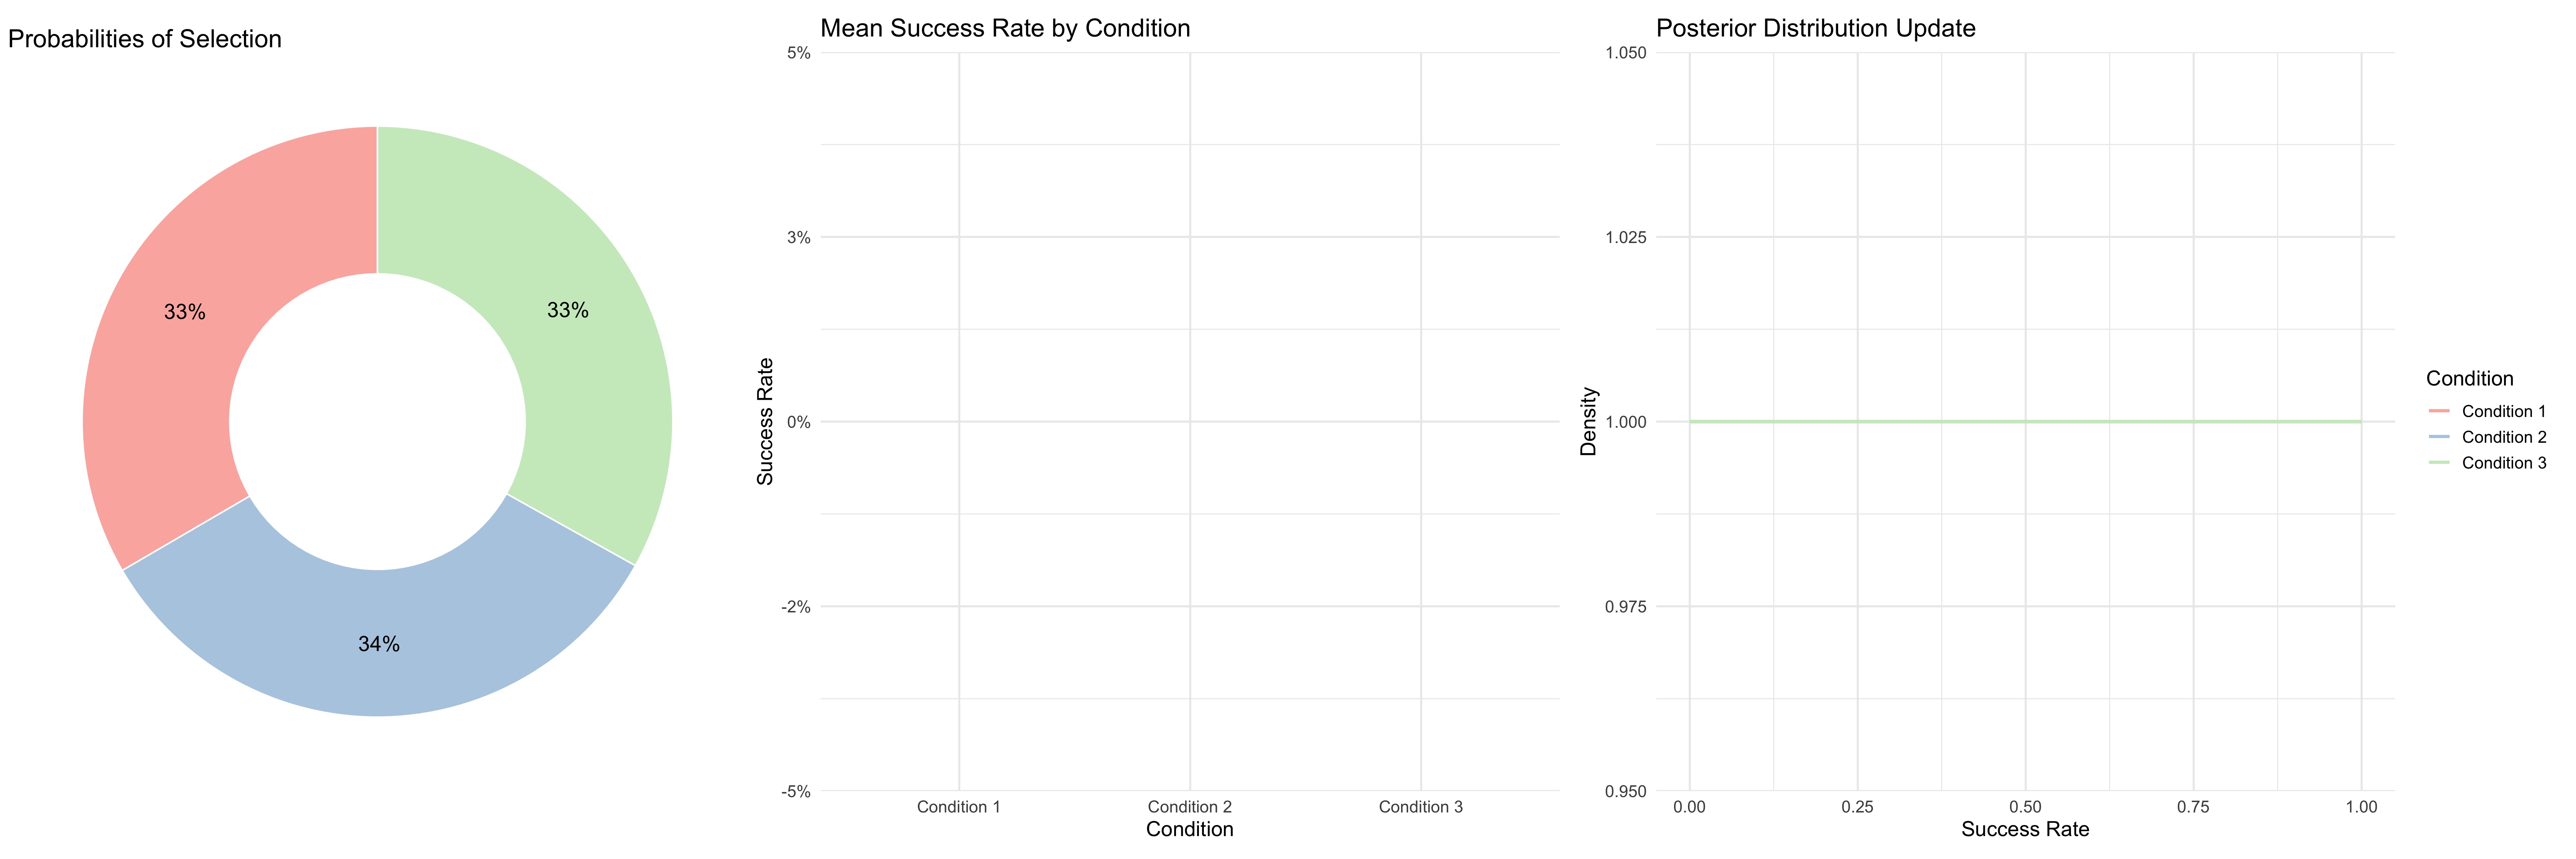
Scenario 1: Starting Point
When beginning an adaptive experiment, we often start with equal probabilities for all conditions if we don’t have prior information (though in practice, you might use historical data to inform your starting points).
In this initial state: - All conditions have an equal (33.3%) probability of being selected - No successes or failures are recorded yet, as no participants have been assigned - The posterior distribution for each condition is uniform (Uniform(0,1)), reflecting our complete uncertainty about which condition will lead to purchases - A “success” is defined as a participant making a purchase (binary outcome: purchase/no purchase)
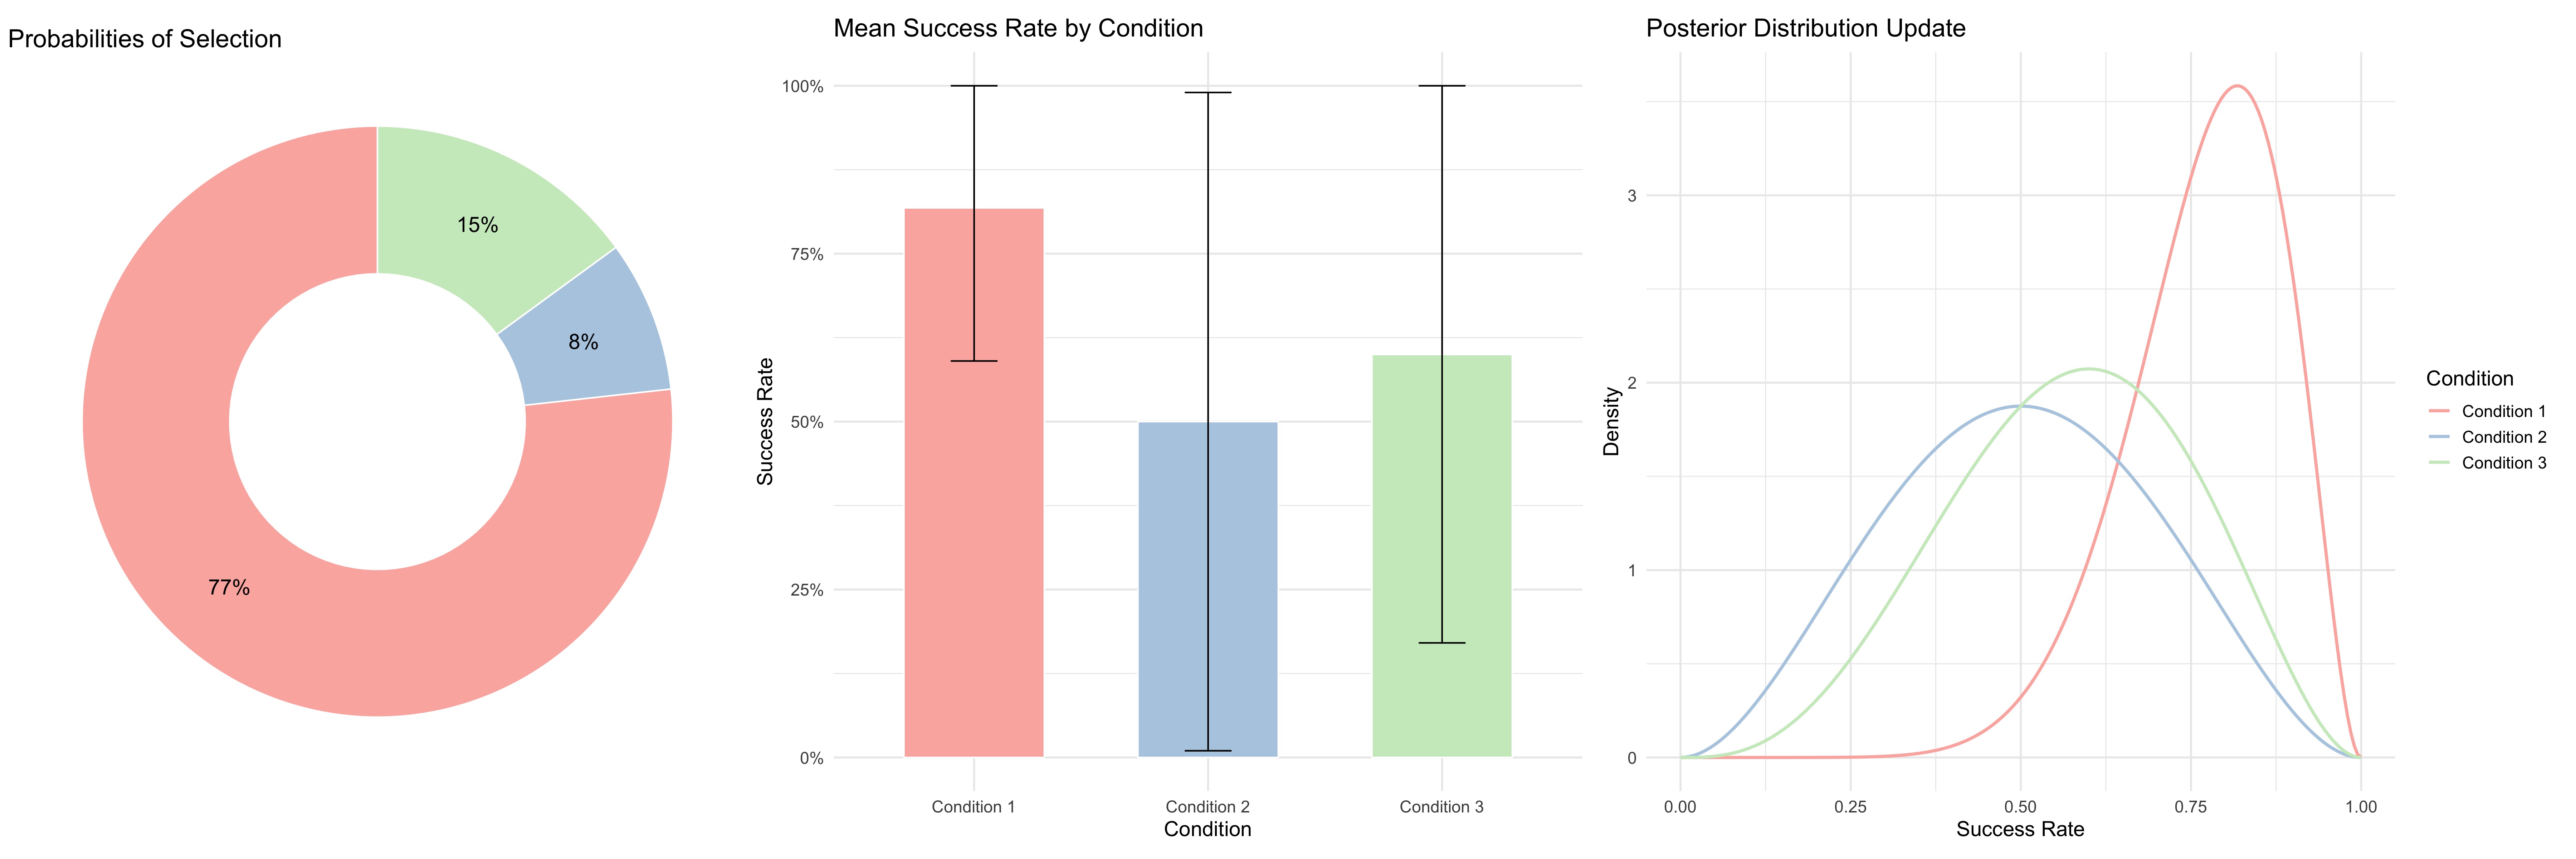
Scenario 2: End of Day 1
After the first day of data collection, here are our results:
- Condition 1 (fixed $5 off): 9 purchases from 11 customers
- Condition 2 (40% off): 2 purchases from 4 customers
- Condition 3 (complimentary food): 3 purchases from 5 customers
Based on these early results:
- Condition 1 shows the highest success rate and gets the highest probability of selection (77%)
- Condition 3 performs slightly better than Condition 2, reflected in its higher selection probability
- However, these are early estimates with high uncertainty:
- We have limited data for Conditions 2 and 3 (high variability in success rates)
- While we have more data for Condition 1, all conditions are still in the learning phase
- Selection probabilities will continue to adjust as we collect more data (as we’ll see in Scenario 3)
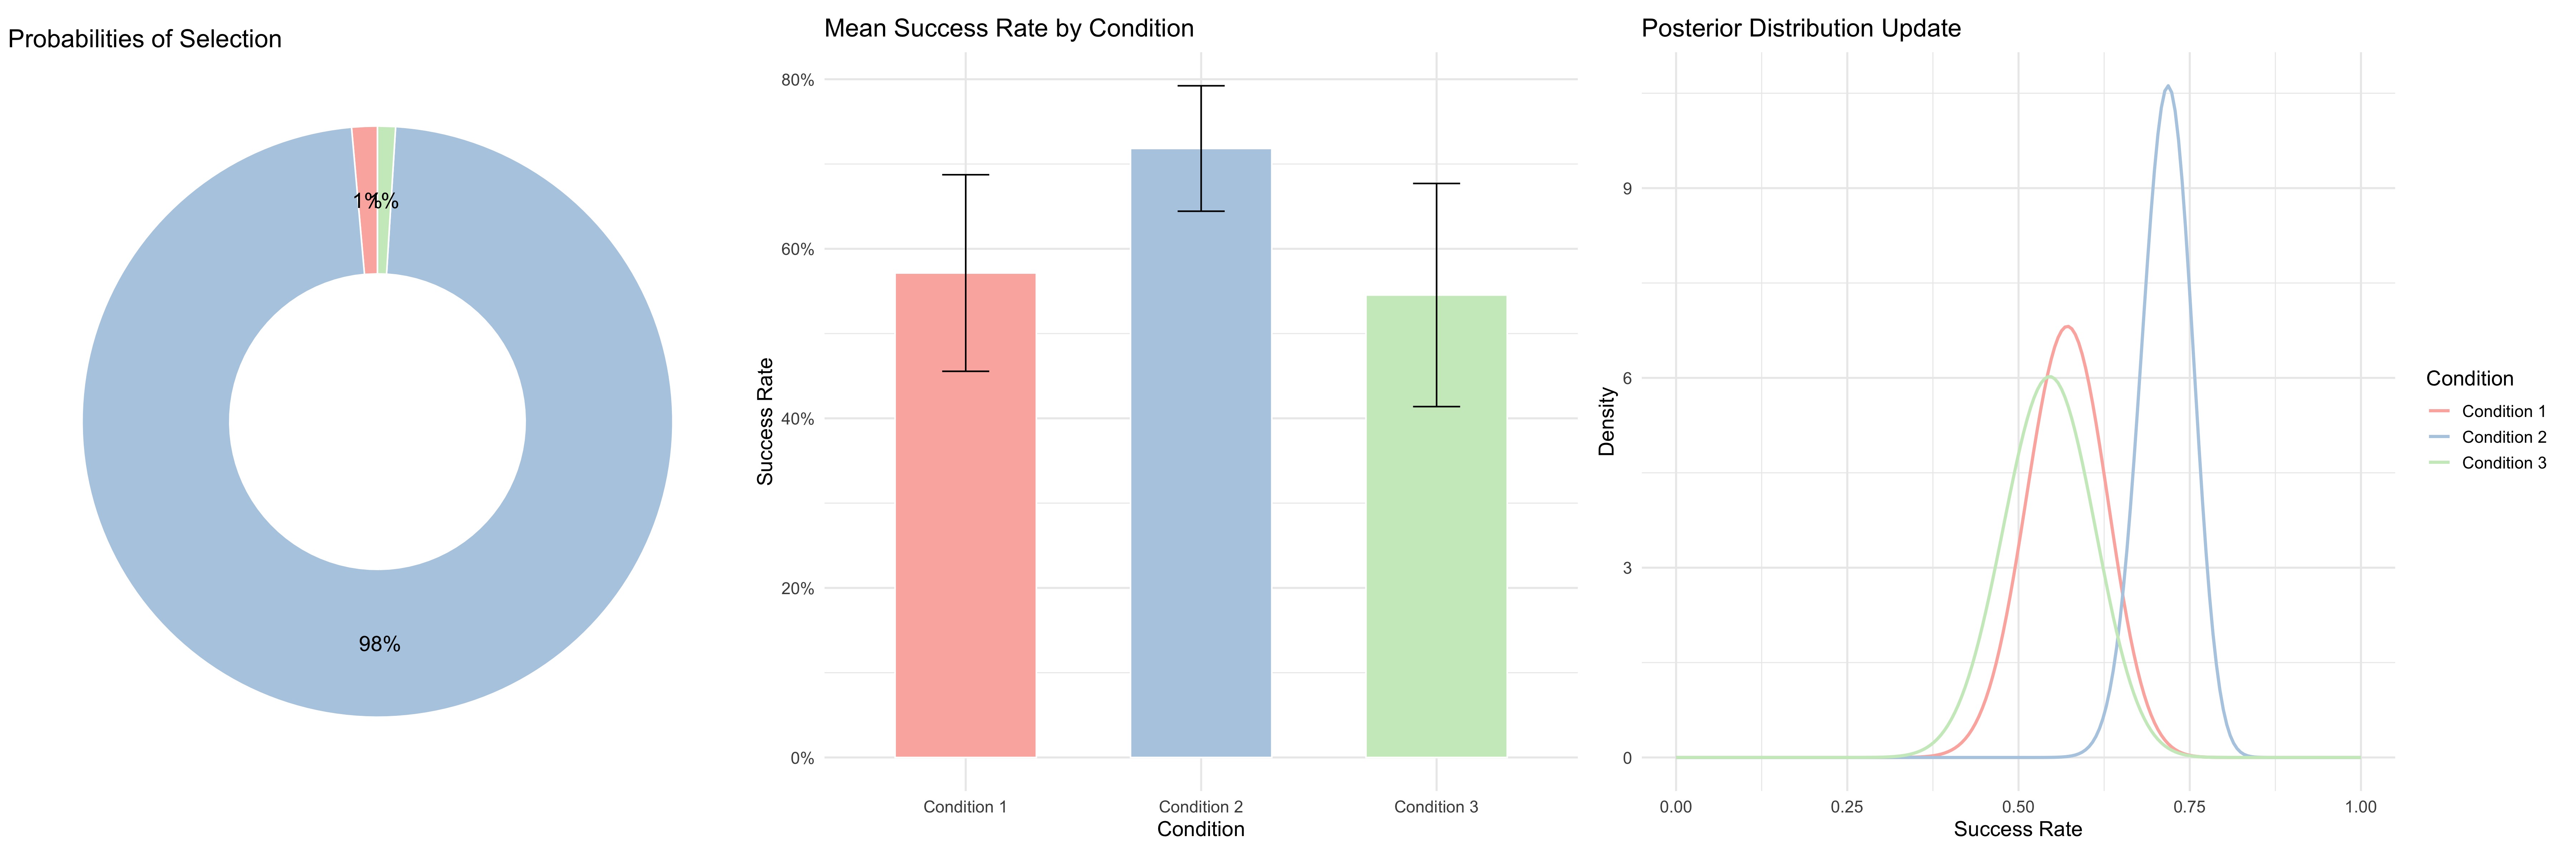
Scenario 3: After One Week
After a week of data collection, here are our results:
- Condition 1 (fixed $5 off): 40 purchases from 70 customers
- Condition 2 (40% off): 102 purchases from 142 customers
- Condition 3 (complimentary food): 30 purchases from 55 customers
Take some time to analyze what happened here using questions below as a starting point.
Bring your thoughts to our Thursday classroom discussion.
Discussion Points
- Selection Probabilities
- Why does Condition 2 now show a significantly higher selection probability?
- Given Condition 2’s low Day 1 probability, how did it receive so many assignments?
- Uncertainty and Evidence
- Examining the confidence intervals (blue bars showing ±1 standard deviation):
- Do we have enough evidence to conclude Condition 2 is best?
- Can we confidently say Condition 1 outperforms Condition 3?
- Examining the confidence intervals (blue bars showing ±1 standard deviation):
- Posterior Distributions
- In the posterior distribution chart:
- Can you identify the area representing Condition 2’s probability?
- How does this compare to Condition 1’s area?
- In the posterior distribution chart:
- Interactive Analysis
- Using the provided interactive dashboard:
- Try simulating the transition from Scenario 2 to 3
- Add successes and failures gradually to see how probabilities evolve
- What patterns do you notice in how the model updates its beliefs?
- Using the provided interactive dashboard:
Interactive Adaptive Experiment Simulator
Link here if below preview does not work